When a sale comes in ahead of expectation or when revenue and profit exceed plan, a leader may refer to extra revenue or extra profit which runs the risk of sending the wrong signal to employees. Continue reading “Extra Revenue” vs. “More Revenue” … Read all about it!
Tag Archives: projection
How to increase the accuracy of revenue forecasts.
Revenue Forecasts asserts that a certain amount of revenue will be earned in a certain period of time with a certain probability that the actual revenue earned in the period will be within a certain tolerance of the forecast. For example, management may forecast that there is a 90% chance of actual revenue being not more than 10% less than a forecasted amount.
Generally speaking, the percent probability of revenue from a source is assigned by management based on their judgement in light of their collective past experience with similar revenue generating opportunities in similar circumstances.
Some managers set forecasts equal Expected Value; that is, their revenue forecast equals the sum of potential revenue generating opportunities each multiplied by an assigned probability of occurring. There are several potential problems with this approach that should be considered carefully before proceeding:
- Summing expected values allows fractional results when there may actually be little to no chance of fractional results. For example, an opportunity to generate revenue of $100,000 with a 50% probability of occuring would contribute $50,000 to a forecast computed as a weighted sum even though the actual result is more likely to either be $0 or $100,000.
- Actual Results are more likely to binary; that is the the result either happens or it does not happen, so fractional results do not occur.
- The percent probability assigned to a given opportunity may reflect the probability of the revenue ever occuring but not be specific to the period in which the revenue will occur. A good approach to forecasting needs to set the probability of revenue in a specific period
- Probabilities assigned often reflect stage of progression through a sales process but do not represent a real assessment of probability of the event occurring. For example, one might assign a 75% probability to all prospective sales for which a proposal has been submitted because it is, at the point of submission, about 75% of the way through the sales process but it may be, in reality, that only 50% of all proposals are successful.
Failure to account for any or all of the three cautions can lead to actual revenue results that are consistently outside the forecast tolerance range.
How to get, and stay, in control of operations.
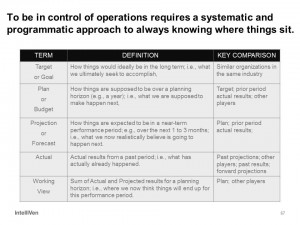
Leaders who are in control of operations compare their organization’s actual performance results to:
- Past results to know whether their organization is trending up, down or sideways.
- The results other organizations that are doing things similar to theirs achieve in order to know how well they are doing relative to industry benchmarks, especially relative to those who do best what they are doing.
- Plan, budget, projection, or forecast in order to hold themselves accountable to what they said would happen.
- Target or goal to know if it is time to be done with what they are doing!

